
First step towards Data Science: Journey to the Home for Data Science

Journey to the Home for Data Science
First step towards Data Science
Getting started with kaggle competitions
Kaggle is an AirBnB for Data Scientists — this is where they spend their nights and weekends. It’s a crowd-sourced platform to attract, nurture, train and challenge data scientists from all around the world to solve data science, machine learning and predictive analytics problems. — Zeeshan-ul-hassan Usmani
Introduction
Kaggle is the best place to Get Started if you want to get your hands dirty in Data Science. If you want then you can read all the What and Why at: https://www.kaggle.com/getting-started/44916. Trust me it is all worthy.
One main thing what makes Kaggle so awesome is, you can find the dataset without any hassle of data gathering and a notebook to write and run your code in the cloud. You can also use the Google’s Colab Jupyter Notebook with their GPU & TPU to write and run your code. They are free.
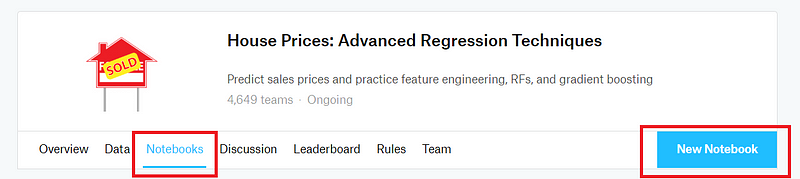
You can easily signup to the platform and get started with the getting started competitions. I am going to show you how to predict the House Prices by getting into House Prices: Advanced Regression Techniques competition. It’s gonna be awesome, let’s get started.
Getting Started
Let's move to the Notebook Section and start a New Notebook on Kaggle:
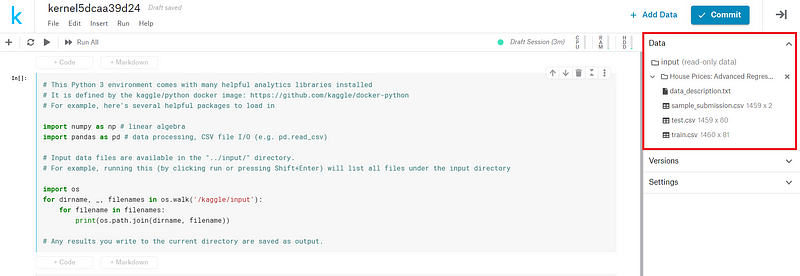
After you start a Notebook you will get a nice Notebook Platform with a list of datasets available on the left side.
Now before starting to write some code, we have to understand the Machine Learning Pipe Line
ML Pipeline
Though Kaggle makes it easy for us by providing the dataset, it is still challenging to process and clean the data and extract the relevant features form it and identify the outliers in dataset. This whole process is called Data Wrangling and it is a part of Feature Engineering.
Let's see what type of data we have got; we are going to use Pandas: Data analysis library for analyzing the dataset. As you can see in the Notebook Pandas and NumPy library is already imported. We have got two dataset files: train.csv and test.csv another sample_submission.csv is just a sample of how our submission should look like.
Code Part
lets see the head data of the train and test set.
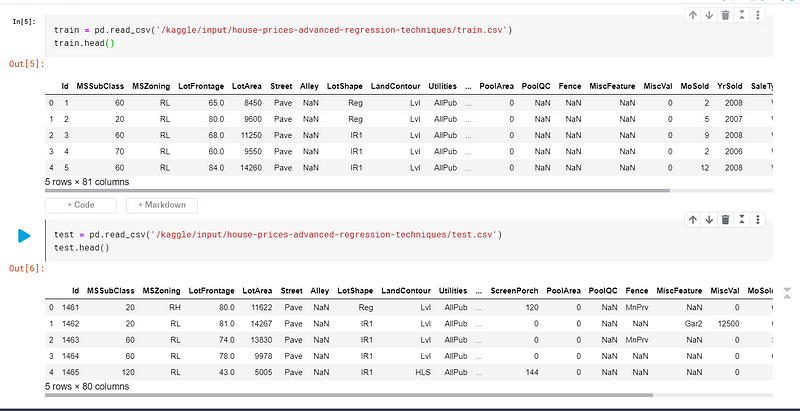
as you can see that we have 81 columns in the train set and 80 columns in the test set; it is because in the test set the label column(SalePrice) is not given. We have to predict the SalePrice for the given features by training a model based on the train set. We also should have domain knowledge in the field so that it makes us easier to know what we are doing. For example: for this project, we are predicting a SalePrice for the House, and domain speaking features that most matters are: House Condition, How is the location, What features are there in house and so on.
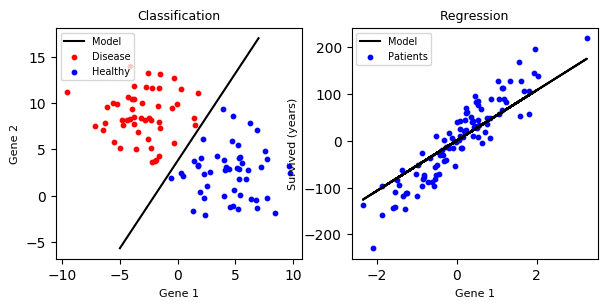
We have given a set of features and a label and we are predicting a continuous value for given features, not a Categorical value; so this is a clear case of a Regression problem, not a Classification Problem.
now we are going to play with the train set (train.csv) to check the skewness of SalePrice data.
normally distributed data makes it easier to analyse
why normally distributed data? you can check here.
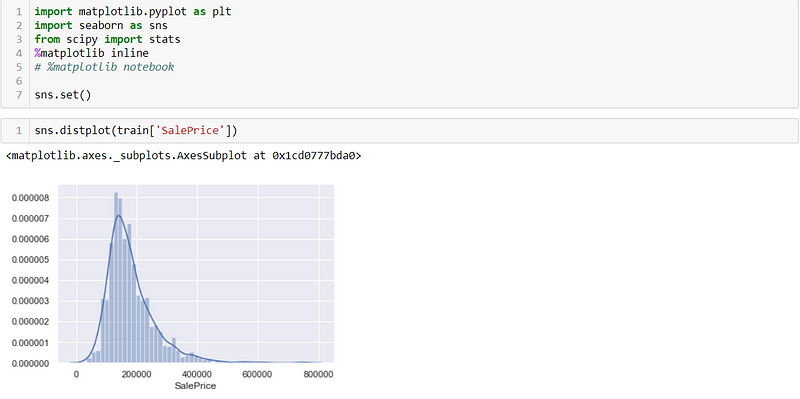
as we can see that the SalePrice is right(Positive) skewed, we have used matplotlib and seaborn to visualize the data.
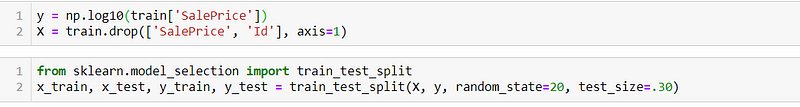
now it’s time for data transform. We can use the log to transform the data into normally distributed data:
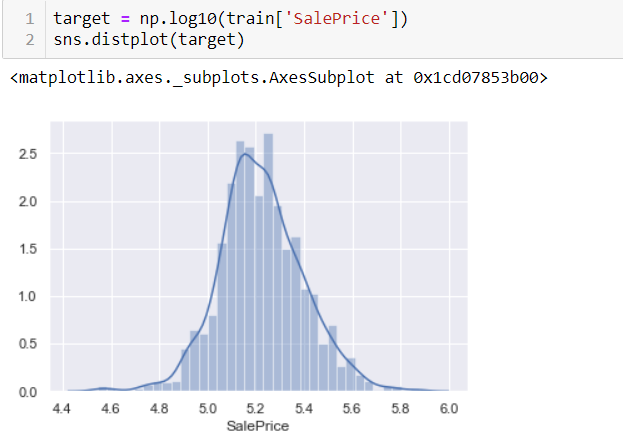
we have used a log with base 10, now the data is normally distributed. To understand why we used a log to transform the data, watch this video.
after that we can check our probability plot:
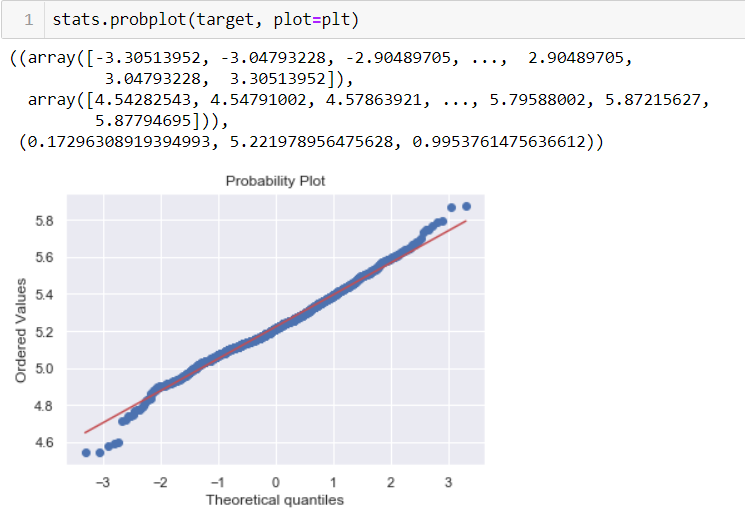
It looks nice, we can move forward.
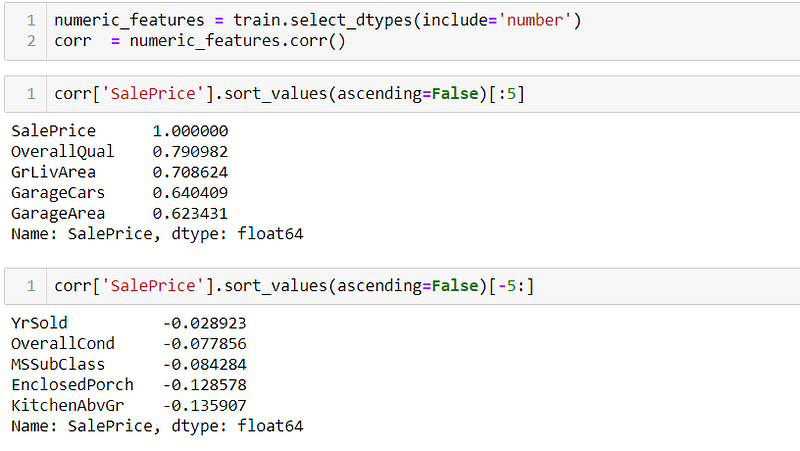
Now we have to check for the highly correlated data. First we are extracting all the numerical data typed features and checking the correlation of those features with respect to the SalePrice.

These first five features are highly correlated to the Sale Price; meaning- these are the values that are linearly correlated and highly affect the SalePrice.
as we can see GarageArea is also highly correlated with the sale price lets visualize the data:

those few points which are higher than 1200 on the x-axis are the outliers for our data. Those few data can affect the model so we have to eliminate them.
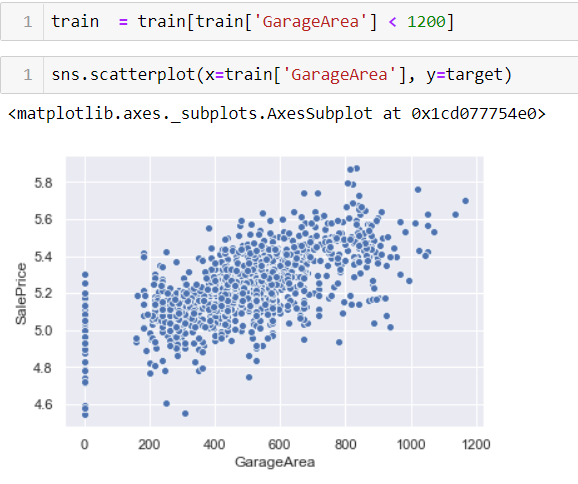
simply we removed them by taking data’s less than 1200. 😄 Just a simple approach.
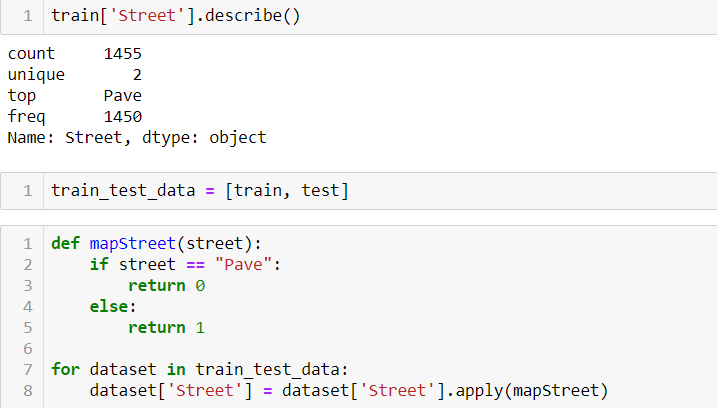
in our dataset, we have the Street feature which has two unique values: Pave and Grvl. This is also a useful feature but it is in String data type; so we are creating a function mapStreet to convert these data into 0 for Pave and 1 for Grvl.
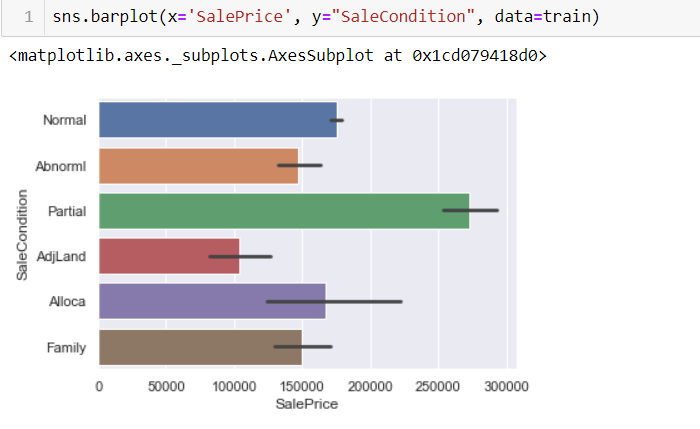
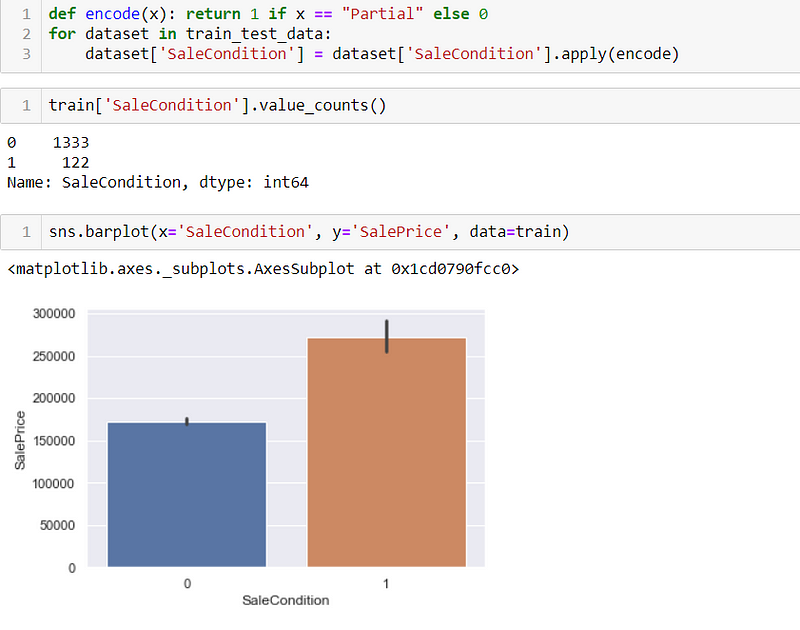
Now it’s time to see the sale price of the house with respect to the same condition. And from the image above we can see that Partial Sale Condition is known to be sold at a High Sale Price so, for ease we group the Partial SaleCondition as 1 and other SaleCondition as 0.
now to make our dataset better we can either drop or use another approach to get rid of all the NAN or null values. For now, we are just dropping it and keeping only the numerical values on the train and test set.

Now we log transform the SalePrice and split the train.csv dataset into two parts: y for labels and x for features and again split those into train set and a test set by using scikitlelarns train_test_split method.
Finally! now we are ready to train the model.

First off, we start by importing a Regression Modal library from Sci Kit learn and giving our training set to train. You can use any appropriate modal for the task. For now, we are using Linear Regression.

we can train our data by just calling a .fit() method on the model. It trains our modal and we can check the score by using the .score() method.
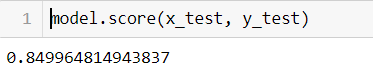
currently, we have an accuracy of around 84%. It’s not that bad, but you can improve the accuracy by tweaking some data and from better feature engineering.

now it’s time to prepare a submission file and submit it on Kaggle.
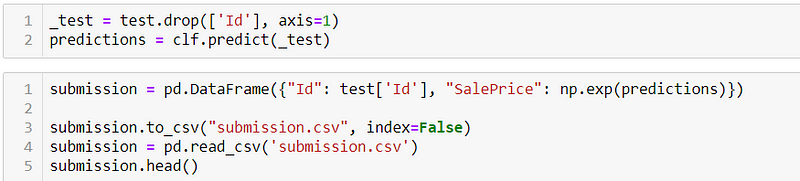
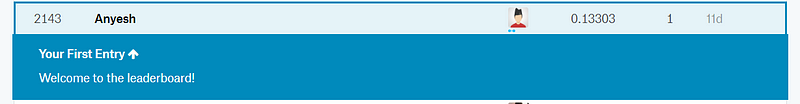
we are using the same model to predict the label for the features in the test.csv file and saving all the outputs with an ID in the submission.csv file. Now you can see your submission file and submit it to the Kaggle’s submit section and see yourself in a public leaderboard.
Final Thoughts
Kaggle competition is a good place to get your hands dirty with real-world datasets. I hope you have learned something. You can keep exploring other datasets on kaggle and carry on to the journey of Data Science by doing exciting projects. Keep learning and stay curious.

Comments ()