Using Machine Learning to know if your chest pain is the sign of Heart Disease or not

Medical Machine Learning
Using Machine Learning to know if your chest pain is the sign of Heart Disease or not
Prerequisites
Before starting the project, you should have basic knowledge of:
- Python
- Pandas (Data analysis library)
- Numpy (Scientific computation library)
- Scikit Learn (For data pre-processing and model selection)
Dataset
We are going to use the Heart Disease Data Set provided by Machine Learning Repository of University of California.
The UCI page mentions following as the principal investigator responsible for the data collection:
1. Hungarian Institute of Cardiology. Budapest: Andras Janosi, M.D.
2. University Hospital, Zurich, Switzerland: William Steinbrunn, M.D.
3. University Hospital, Basel, Switzerland: Matthias Pfisterer, M.D.
4. V.A. Medical Center, Long Beach and Cleveland Clinic Foundation:Robert Detrano, M.D., Ph.D.
Introduction
In this project we are going to classify whether the chest pain is the indication of Heart Disease or not by using the person’s Age, Sex, Type of Chest Pain, Blood Pressure, Cholesterol Level and their Heart Disease status data.
Code Part
2.1 Preparing Data
First of all let’s look at our Data Dictionary:
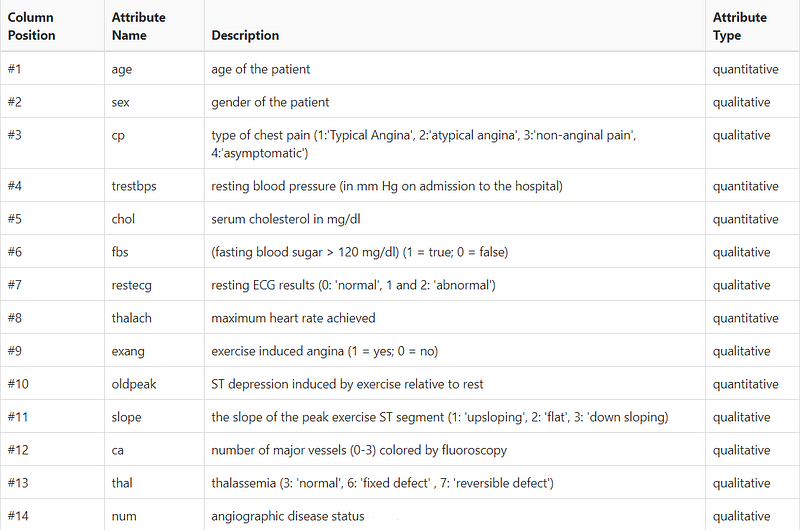
Here we have total of 14 columns, 13 columns for our features and 1 column for the label.import pandas as pddf = pd.read_csv('data.csv')
We are using pandas for data processing.df.head()

Here in our data set we do not have names of the columns, now it’s our task to add name to the respective columns according to the data dictionary.
Again we are going to read the csv file using pandas but this time we are going to add names to the columns as well.df = pd.read_csv('data.csv', sep=",", names=["Age", "Sex", "CP", "Trestbps", "Chol", "Fbs", "Restecg", "Thalach", "Exang", "Oldpeak", "Slope", "CA", "Thal", "Label"])df.head()

Now this looks good.
2.2 Exploring Data
Lets check the info and if there are any null values in the data set.df.info()
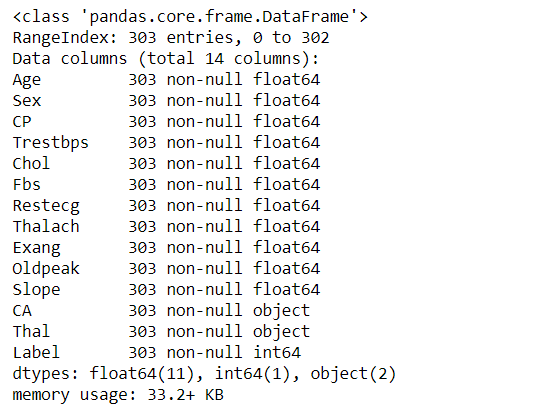
As you can see, we have 303 entries for every column and there are no any null values. It is good sign for us.
Now without any delay lets start Feature Engineering.
2.3 Feature Engineering
As we all know Feature Engineering is the most crucial part in Data Science. From here we should be able to get insights of our data and Engineer the best features which contributes positively more to our classification.
2.3.1 Fixing Data
By observing the data we can see that values at label column is little off. Since it is a binary classification problem there should be 0 or 1 values but here we have 5 different of values.
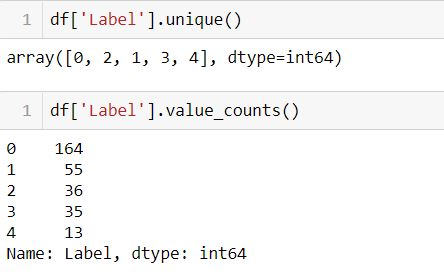
If we look at the data description provided by UCI we can see that label(num) column values are divided into 2 categories:
- value 0 : means no heart disease
- value 1 : means has heart disease

from this lets assume that values grater than 1 also falls under has heart disease category.
Lets write a function to map the values:def mapLabels(value):
if value > 0:
return 1
else:
return 0
the function above takes the value and return 1 if value is grater than 0 else returns 0.
Lets map that to our Label:df['Label'] = df['Label'].map(mapLabels)
df['Label'].value_counts()

Another off thing in our data is:
at our CA and Thal column we have it as a object data type but values are float.import numpy as npdf.select_dtypes([np.object]).head()
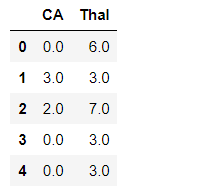
Here we are using numpy to select object data type from our data set.
After a little dig in i found out that, CA and Thal column has some null values set as ‘?’.
Lets fix this data as well:def caToFloat(value):
if not value == '?':
return float(value)
else:
return 0df['CA'] = df['CA'].map(caToFloat)
Here we are mapping the values of our CA column to float value and any value with ‘?’ to 0. Since there were only few ‘?’ data and our data was originally was of [0–3] categories; it is okay to map them to 0.

for Thal data:df['Thal'].value_counts()
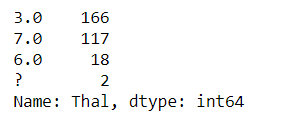
As we can see, our majority of data are of 3.0 value, so we can map that ‘?’ values to 3.0 since they are only 2 in numbers.df['Thal'] = df['Thal'].map(lambda x : 3.0 if x == '?' else float(x))df['Thal'].value_counts()
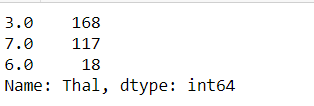
Now lets check our data info:df.info()
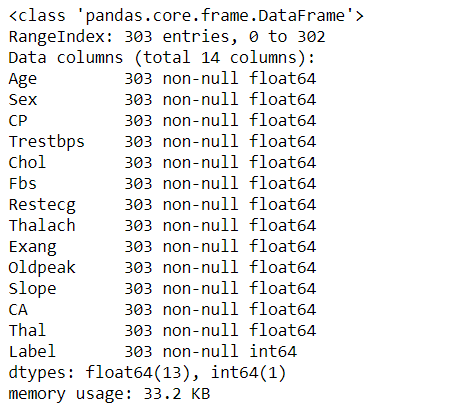
Our all values are numeric.
Lets engineer our continuous Age data to class data:df.loc[df['Age'] <= 16, 'Age'] = 0,
df.loc[(df['Age'] > 16) & (df['Age'] <= 26), 'Age'] = 1,
df.loc[(df['Age'] > 26) & (df['Age'] <= 36), 'Age'] = 2,
df.loc[(df['Age'] > 36) & (df['Age'] <= 62), 'Age'] = 3,
df.loc[df['Age'] > 16, 'Age'] = 4
Here, we have categorized our Age data to [0,1,2,3,4] classes where:
Child: 0 Young: 1 Adult: 2 Mid-age: 3 Senior: 4df['Age'].value_counts()

As you can see we do not have any children or young in our data.
This helps for the better classification. You can look for other features and engineer them as well.
2.4 Data Pre-Processing
Now its time to prepare our data for classification.labels = df['Label']
features = df.drop(['Label], axis=1)
Here we are separating the features and labels from our dataframe.
Now we are going to split our data into train and test data using scikitlearn.from sklearn.model_selection import train_test_splittran_x, test_x, train_y, test_y = train_test_split(features,labels, shuffle=True)
2.5 Model Selection
Now we are ready to train our data.
For selecting our best model and train our data on that, we are going to use sklearn.from sklearn.svm import SVC
from sklearn.tree import DecisionTreeClassifier
from sklearn.ensemble import RandomForestClassifier
from sklearn.naive_bayes import GaussianNB
from sklearn.model_selection import KFold, cross_val_score
from sklearn.ensemble import GradientBoostingClassifierk_fold = KFold(n_splits=12, shuffle=True, random_state=0)
Here we are going to cross validate our data with KFold and select our best model from these different classification models.
KFold allows us to validate all over our train data and help find our best model.

Here we are going to use 12 KFold splits.
Now lets train our first model which is SVC or SVM(Support Vector Machine)clf = SVC(gamma='auto')
scoring = 'accuracy'
score = cross_val_score(clf, train_x, train_y, cv=k_fold, n_jobs=1, scoring=scoring)
print(score)
## OUTPUT: 61.38
From SVC we are getting only 61.38% of accuracy.
Lets see on other model as well:
Gradient Boosting Classifierclf = GradientBoostingClassifier()
scoring = 'accuracy'
score = cross_val_score(clf, train_x, train_y, cv=k_fold, n_jobs=1, scoring=scoring)
round(np.mean(score)*100, 2)## OUTPUT: 77.35
Decision Tree Classifierclf = DecisionTreeClassifier()
scoring = 'accuracy'
score = cross_val_score(clf, train_x, train_y, cv=k_fold, n_jobs=1, scoring=scoring)
round(np.mean(score)*100, 2)## OUTPUT: 75.91
Random Forestclf = RandomForestClassifier(n_estimators=10)
scoring = 'accuracy'
score = cross_val_score(clf, train_x, train_y, cv=k_fold, n_jobs=1, scoring=scoring)
round(np.mean(score)*100, 2)## OUTPUT: 83.28
Naive Bayesclf = GaussianNB()
scoring = 'accuracy'
score = cross_val_score(clf, train_x, train_y, cv=k_fold, n_jobs=1, scoring=scoring)
round(np.mean(score)*100, 2)## OUTPUT : 85.95
As we can see we have got high score on Naive Bayes so we are going to use this classifier for our classification.
Our scores are low because we haven't engineered our data properly. You can achieve more score by more data cleaning and feature selection.
You can also tune the hyper parameters for better results.
2.6 Training Model
Let’s train our model using Naive Bayes Classifier Algorithm:clf = GaussianNB()
clf.fit(train_x, train_y)
Now let’s see our predictions:predictions = clf.predict(test_x)
values = list(zip(predictions, test_y.values))status = []
for x, y in list_of_values:
status.append(x == y)
list_of_values = list(zip(predictions, test_y.values, status))final_df = pd.DataFrame(list_of_values, columns=['Predicted', 'Actual', "Status"])
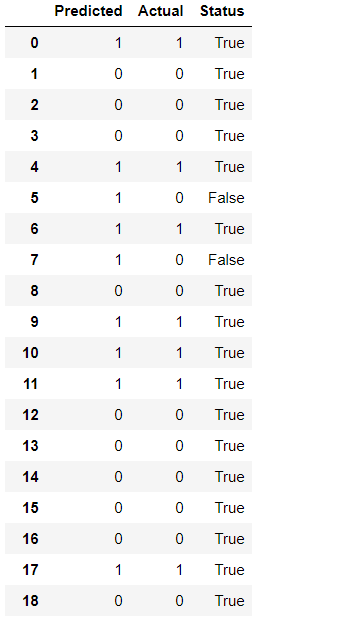
Here we can see we have few false classification also, you can improve these by improving our features selection.
Conclusion
Now our model is able to predict indication of heart disease by given various features 😀.
Classification problems can be sometimes easy and sometimes it can be very hard, it all depends on what kind of data you use and how much effort you have applied on feature selection + models hyper parameters selection.
For beginners like us to understand how ML works exploring data sets and solving problems are best way to learn.
This is it for now. Hope you have enjoyed the project and learned something.


Comments ()